
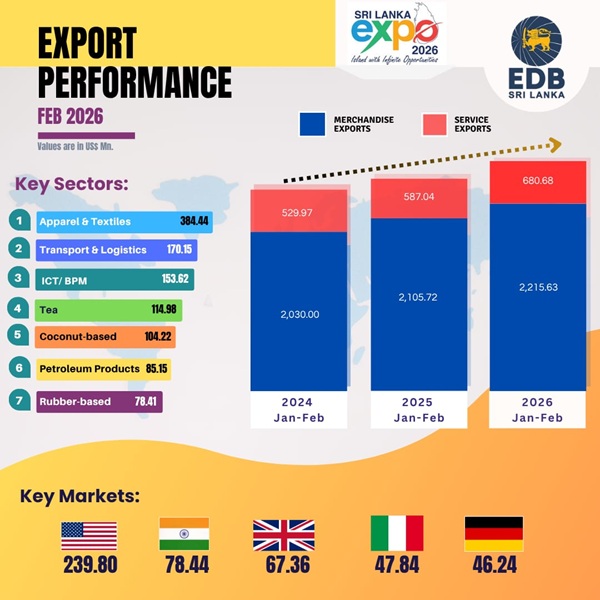
The Export Development Board (EDB) says Sri Lanka’s total exports, including both merchandise and services, reached US$ 1,401.78 million in February 2026, reflecting a notable year-on-year growth of 4.22% compared to February 2025.
According to provisional data from Sri Lanka Customs, along with estimated figures for Gems & Jewellery and Petroleum Products, merchandise exports for February 2026 increased by 1.32% to US$ 1,066.88 million.
Meanwhile, services exports demonstrated strong momentum, with earnings estimated at US$ 334.9 million, marking a significant 14.68% increase over the corresponding month in 2025. This robust performance underscores the growing contribution of the services sector to the country’s export portfolio.
On a cumulative basis, total exports for the period January to February 2026 are estimated at US$ 2,896.31 million, recording a notable growth of 7.56% compared to the same period in 2025.
The continued expansion in export earnings highlights the resilience of Sri Lanka’s external sector, supported by steady merchandise performance and accelerated growth in services exports.
Commenting on this achievement, Mangala Wijesinghe, Chairman and Chief Executive Officer of the Sri Lanka Export Development Board (EDB), stated:
“Sri Lanka’s export earnings for February 2026 reached US$ 1,401.78 million, recording a solid year-on-year growth of 4.22% and signalling a positive trajectory toward achieving our annual export targets.
This performance reflects the resilience and increasing competitiveness of Sri Lanka’s export sector, underpinned by the gradual recovery in key international markets, sustained industrial capacity, and the continued implementation of targeted export development initiatives.
Looking ahead, with strengthened policy support, enhanced value addition, and proactive market diversification, Sri Lanka is poised to build on this momentum throughout 2026, even amid ongoing geopolitical tensions and energy market volatility”
Further analysis indicates that cumulative merchandise export earnings amounted to US$ 2,215.63 million during January–February 2026, reflecting a 5.22% increase compared to the corresponding period in 2025.
Meanwhile, services exports maintained a strong upward trajectory, recording an estimated 15.95% growth during the same period, reaching US$ 680.68 million.
This robust expansion highlights the increasing importance of Sri Lanka’s knowledge-based economy and its growing contribution to national export earnings.
The services sector, comprising ICT/BPM, Construction, Financial Services, and Transport & Logistics, continues to play a pivotal role in diversifying the country’s export base while generating high-value employment opportunities across the economy.
Full statement:
Major Exports in February 2026
- Products and Services with Positive Growth (Increases)
Coconut-based products also recorded a strong performance, with export earnings increasing 25.22 % year-on-year in February 2026. Within this sector, earnings from Coconut Kernel Products increased by 33.07 %, while Coconut Shell Products grew by 69.96%, reflecting strong global demand and enhanced value addition.
Among Coconut Kernel Products, February 2026 exports showed substantial gains: Coconut Oil (+35.34%), Coconut Cream (+40.82%), and Liquid Coconut Milk (+25.73%) compared to February 2025. Meanwhile, earnings from Activated Carbon, a key Coconut Shell product, increased by 68.84 %, reaching US$ 21.73 million, underscoring the sector’s expanding contribution to Sri Lanka’s export earnings.
The Food & Beverages sector recorded a significant 36.36% year-on-year increase, reaching US$ 56.22 Mn, with processed foods contributing the largest share of growth (+72.95%).
Exports of Spices and Essential Oils recorded a growth of 3.98% to US$ 39.44 million during the same period, mainly supported by a strong performance in cinnamon exports, which surged by 41.88%.
Electrical and electronic components recorded remarkable growth, with export earnings surging by 54.37% to US$ 48.35 million. This growth was driven by strong increases in exports of electrical transformers and switches, boards and panels, which expanded by 42.56% and 67.03% respectively in February 2026 compared to the same period in 2025.
The estimated export value of Diamonds, Gems & Jewellery is expected to increase by 11.51%, reaching US$ 30.86 Mn in February 2026 compared to February 2025.
Meanwhile, except for construction services, other export services are estimated to record positive growth in February 2026 compared with February 2025: ICT/BPM (+36.66%, US$ 153.62 Mn), Financial Services (+18.91%, US$ 4.78 Mn), and Transport and Logistics (+0.86%, US$ 170.15 Mn). This performance underscores the continued expansion and resilience of Sri Lanka’s knowledge and services-driven economy, highlighting its growing contribution to national export earnings.
Products with Negative Growth (Decreases)
Tea exports, accounting for 12.8% of total merchandise exports, declined by 3.71% to US$ 114.98 million in February 2026, driven primarily by reduced earnings from Bulk Tea (-2.14%) and Tea Packets (-6.78%). Export volumes also fell by 2.34%, with key markets such as Russia registering a notable decline of 33.31%, exerting downward pressure on overall performance.
Export earnings from Rubber and Rubber-Based Products declined by 5.66% year-on-year to US$ 78.41 million in February 2026, primarily due to contractions in major product categories. Exports of Pneumatic and retreaded rubber tyres and tubes decreased by 4.44%, while Industrial and Surgical Rubber Gloves declined by 5.14%, weighing on overall sector performance
Export earnings from Apparel & Textiles declined by 10.03% year-on-year to US$ 384.44 million in February 2026, primarily due to a 3.09% reduction in shipments to the United States and a sharp 19.33% contraction in exports to the European Union.
Seafood exports also recorded a significant decline, falling by 16.84% year-on-year to US$ 11.31 million. This downturn was driven by decreases in key product categories, including frozen fish (-25.52%) and shrimps (-41.82%), while ornamental fish exports dropped by 29.33% to US$ 0.53 million.
Exports during the period of January – February 2026
Cumulative total exports, including both merchandise and services, are estimated at US$ 2,896.31 million for the period January–February 2026, reflecting a notable growth of 7.56% compared to the same period in 2025.
Merchandise exports during the first two months of 2026 are estimated to have increased by 5.22% to US$ 2,215.63 million, based on provisional data from Sri Lanka Customs together with estimated figures for Gems & Jewellery and Petroleum Products.
Meanwhile, earnings from services exports are estimated to have grown significantly by 15.95% to US$ 680.68 million compared to the corresponding period in 2025.
- Products & Services with Positive Growth (Increases)
Earnings from the export of Tea, Coconut products, and Food & Beverages increased by 2.04 %, 27.86 %, and 30.84%, respectively during the period of January – February 2026 in comparison to the corresponding period of 2025.
Earnings from the export of Tea increased y-o-y by 2.04 % to US$ 236.84 Mn in the period of January to February 2026. This increase was mainly due to the strong performance in the export of Bulk Tea (3.5 %).
Export earnings of Coconut & Coconut-based products increased by 27.86 % to US$ 203.01 Mn during January – February 2026 compared to the last year. Earnings from all the major categories of Coconut based products increased in the period of January – February 2026 compared with the corresponding period of 2025 due to the strong performance in export of Coconut Oil (53.98 %), Desiccated Coconut (48.62 %), Coconut Milk Powder (16.54 %), Coconut Cream (44.17 %), Liquid Coconut Milk (24.37 %), and Activated Carbon (53.26 %).
Export earnings from Food & Beverages have increased by 30.84 % y-o-y to US$ 108.56 Million in the period of January to February 2025, with the positive performance in exports of Processed food (49.39 %).
Further, export earnings from Seafood increased by 30.28 % to US$ 40.74 Mn during the period of January to February 2026 compared to 2025 due to the strong performance in frozen fish (+9.77%) and Fresh Fish (+103.09%).
Meanwhile, earnings from export of Electrical and Electronic Components (EEC) increased by 52.74 % to US$ 91.28 Mn in the period of January to February 2026 compared to the corresponding period of 2025. This increase was due to the strong performance in exports of Insulated Wires and Cables (+37.12%), Printed Circuits (+14.71%), Switches, Boards & Panels (+39.32%).
Furthermore, the estimated value of ICT exports is expected to increase by 37.25 % to US$ 306.62 Mn during the period of January to February 2026 when compared to the corresponding period of 2025.
In addition, the estimated value of Logistics & transport services is expected to increase by 5.31 % to US$ 354.59 Mn during the period of January to February 2026 when compared to the corresponding period of 2025.
Products with Negative Growth (Decreases)
Export earnings from Rubber & Rubber finished products decreased by 1.14 % to US$ 156.38 Mn in January – February 2026 compared to the same period in 2025 attributed to decreased exports of Industrial & Surgical Gloves of Rubber (-8.17 %).
Export earnings from Apparel & Textiles declined by 6.29% to US$ 831.67 million during the January–February 2026 period, compared to the same period in 2025. This contraction was largely influenced by reduced demand in key markets, with exports to the United States and the European Union, together accounting for more than 50% of total market share, declining by 2.9% and 2.8%, respectively.
In addition, export earnings from Spices and Essential Oils slightly decreased y-o-y by 0.35 % to US$ 76.65 Mn in the period of January to February 2026. This decrease was due to the poor performance in exports of Pepper (-40.88 %), Cloves (-77.36 %).
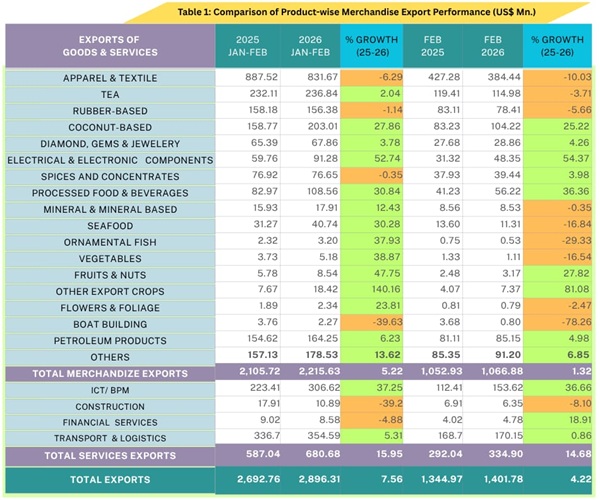
Table 1 shows a comparative analysis of merchandise export performance for February 2025–2026, along with the cumulative figures for the January–February period.
Sri Lanka’s Export Performance in Major Markets
Among the top ten export markets, the United Arab Emirates, China, Australia, and Mexico demonstrated positive year-on-year growth both in February 2026 and cumulatively for the January–February period, indicating emerging market resilience.
Meanwhile, the United States, the largest single export destination for Sri Lanka, accounting for around 22% of total merchandise exports, recorded a marginal decline of 0.3% to US$ 239.8 million in February 2026, with cumulative exports for January–February 2026 also marginal down by 0.61% to US$ 497.65 million compared to the same period in 2025
India consolidated its position as Sri Lanka’s second-largest export destination, surpassing the United Kingdom, with exports growing by 16.21% to US$ 192.01 million during January–February 2026, despite a temporary dip in February. Meanwhile, exports to the United Kingdom declined by 1.86% to US$ 149.44 million over the same period, reflecting weaker performance in this key European market.
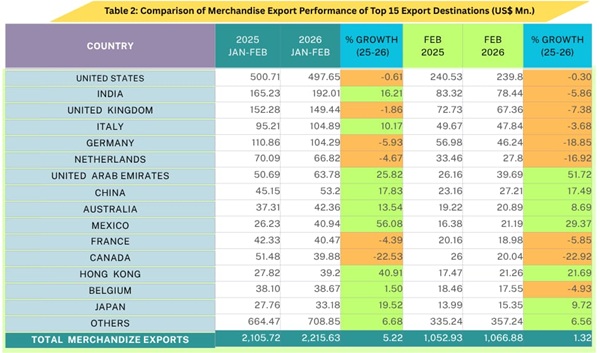
Table 2 shows a comparative analysis of merchandise export performance across the top 15 export markets for February 2025–2026, along with the cumulative figures for the January–February period.
Exports to FTA Partners (India & Pakistan)
- February 2026
Exports to India and Pakistan together accounted for 7.8% of Sri Lanka’s total merchandise exports in February 2026, totaling US$ 84.7 million, a year-on-year decline of 4.07%.
Exports to India decreased by 7.35% to US$ 78.44 million, mainly due to lower shipments of pepper and certain textile and apparel items.
Exports to Pakistan increased by 1.28% to US$ 6.25 million, supported by higher shipments of other textile articles, desiccated coconut, and chemical products.
- January – February 2026
Over the cumulative January–February period, exports to India expanded significantly by 16.21% to US$ 192.01 million. The growth was driven primarily by higher shipments of Petroleum oils, Animal feed, and Areca nuts.
Meanwhile, exports to Pakistan surged by 29.9% to US$ 14.77 million, reflecting robust performance in other textile articles, betel leaves, desiccated coconut, woven fabrics, and base metal products.
Sri Lanka’s Export Performance in Regions
Table 3 shows the comparison of region wise exports for February 2025–2026, along with the cumulative figures for the January–February period.
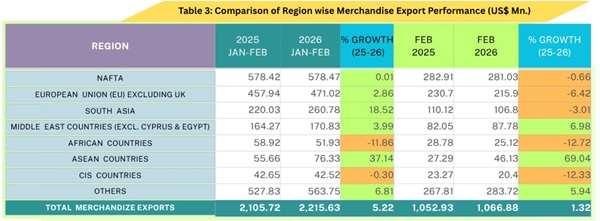
Exports to the European Union (EU), which represent 24% of Sri Lanka’s total merchandise exports, increased by 2.86% in February 2026. However, during the cumulative period from January to February 2026, they declined by 6.42%
Exports to the top five EU markets were recoded as; Italy US$ 104.89 Mn (increased by 10.17 %), Germany US$ 104.29 Mn (decreased by 5.93 %), Netherlands US$ 66.82 Mn (decreased by 4.67 %), France US$ 40.47 Mn (decreased by 4.39 %) and Belgium US$ 38.67 Mn (increased by 1.5 %) during the cumulative period of January to February 2026 in comparison to the corresponding period in 2025. (Newswire)