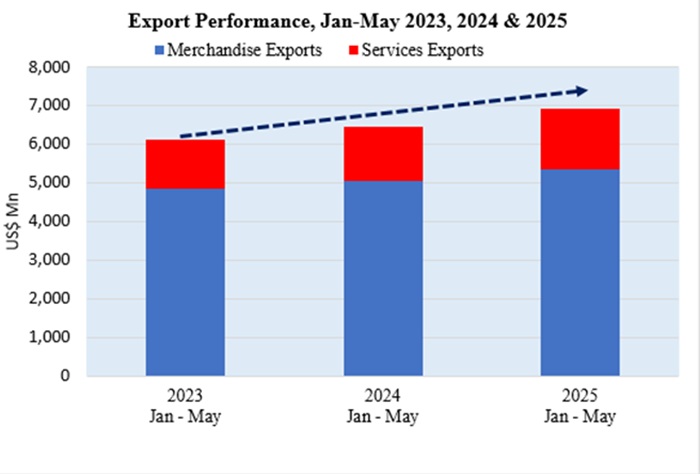
Sri Lanka’s export sector demonstrated remarkable resilience and steady progress during the first five months of 2025, with total exports reaching US$6,933.35 million, marking a robust 7.14% growth compared to the same period in 2024.
According to the Export Development Board (EDB), total exports, including both merchandise and services, reached US$1,386.66 million in May 2025. This shows an impressive year-on-year growth of 6.35% over May 2024, reflecting the resilience of Sri Lanka’s export sector and the positive impact of strategic efforts to diversify markets and enhance competitiveness.
In May 2025 alone, merchandise exports grew by 1.70 % year-on-year, reaching US$1,028.52 million, according to provisional data of Sri Lanka Customs, including the estimates for Gems & Jewellery and Petroleum Products. For the period January to May 2025, merchandise exports totalled US$5,344.23 million, reflecting a 5.46% increase compared to the same period in 2024.
Meanwhile, services exports have emerged as a key driver of overall export growth. In May 2025, earnings from services exports were estimated to be US$358.14 million. Over the first five months of the year, services exports are estimated to have increased by 13.20%, totalling US$1,589.12 million. This trend highlights the rising importance of Sri Lanka’s knowledge-based economy and its growing contribution to national export earnings.
The services export sector, comprising ICT/BPM, Construction, Financial services, and Transport & Logistics, continues to diversify Sri Lanka’s export portfolio and create high-value employment opportunities across the Island.
Full statement of the EDB :
Major Exports in May 2025
- Products and Services with Positive Growth (Increases)
Export earnings from tea, which made up 12.8% of merchandise exports, increased by 14.58 % y-o-y to US$131.81 Mn in May 2025 compared to May 2024. This increase is mainly due to the strong performance in the export of Tea Packets (14.61%).
In addition, the volume of tea exports increased by 13.78 % in May 2025 compared to the same month in 2024. Notably, tea exports to Iraq, Libya and Iran recorded significant increases of 53.74%, 236.84%, and 123.31 %, respectively.
A monthly analysis reveals that export earnings from coconut-based products show a significant increase of 33.33% in May 2025 compared to the same month in 2024. Notably, earnings from Coconut kernel products increased by 48.78%, Coconut fibre products by 13.45%, and Coconut shell products by 35.29%, reflecting strong global demand and improved value addition across the sector.
Export earnings from Coconut Oil, Coconut Milk powder, Coconut Cream and Liquid Coconut Milk, which are categorized under the Coconut kernel products, increased by 93.59%, 52.77%, 47.26% and 36.92% respectively in May 2025 compared to May 2024.
Being the largest contributor to the Coconut-based sector, Coco Peat, Fibre Pith & Moulded products, which are categorized under the Coconut fibre products, increased by 8.06% to US$18.76 Mn in May 2025 in comparison to May 2024.
Earnings from Activated Carbon, which is categorized under the Coconut shell products, increased by 35.29% to US$16.33 Mn in May 2025 compared to May 2024.
Similarly, export earnings from Spices and Essential Oils increased by 20.25% to US$30.64 Mn in the month of May 2025 compared to the month of May 2024, mainly due to the strong performance in the export of Cinnamon (67.65%) and Cloves (37.00%).
Export earnings from Food & Beverages have increased by 17.22% y-o-y to US$49.49 Mn in May 2025, with the positive performance in exports of Processed Food (32.45%).
In addition, export earnings from the Electrical & Electronics Components increased by 23.12% y-o-y to US$38.02 Mn in May 2025, with a notable increase in the exports of Electrical Transformers (63.64 %) and Switches, Boards & Panels (52.91%).
Moreover, the estimated value of Diamonds, Gems & Jewellery is expected to increase by 5.53% to US$31.40 Mn in May 2025 when compared to May 2024.
Furthermore, the estimated value of Logistics & transport services is expected to increase by 31.40% to US$206.14 Mn in May 2025 when compared to May 2024.
- Products with Negative Growth (Decreases)
Export earnings from Apparel & Textiles have slightly decreased by 0.38 % y-o-y to US$388.81 Mn in May 2025, compared to May 2024.
Export earnings from Rubber and Rubber Finished products have decreased by 9.33% y-o-y to US$73.6 Mn in May 2025, with the poor performance in exports of Sheet Rubber (- 40.91 %).
Export earnings from Seafood decreased by 22.11% to US$13.56 Mn in May 2025 compared to May 2024. This decrease was mainly due to the negative performance in ethe xport of Fish Fresh or Chilled (-53.64%).
Furthermore, export earnings from Ornamental fish decreased by 57.43% to US$0.86 Mn in May 2025 compared to May 2024.
Exports during the period of January – May 2025
Cumulative total exports, including both merchandise and services, were estimated at US$6,933.35 Mn for the period January to May 2025, making a notable 7.14% growth compared to the same period in 2024.
Merchandise exports during the first five months of 2025 are estimated to increase by 5.46%, reaching US$5,344.23 Mn, based on data from Sri Lanka Customs, along with the estimated figures for Gems & Jewellery and Petroleum Products.
Products & Services with Positive Growth (Increases)
Earnings from export of Apparel, Tea, Coconut products, Spices & Concentrates and Food & Beverages increased by 9.20 %, 7.93 %, 26.89 %, 53.76 % and 15.21 % respectively during the period of the first five months of 2025 in comparison to the corresponding period of 2024.
Earnings from the export of Apparel & Textile have increased by 9.20 % to US$2136.74 Mn during the period of January to May 2025 compared to the same period in 2024. Notably, exports to the United States and the United Kingdom increased by 6.82 % and 4.00 %, amounting to US$753.37 Mn and US$303.04 Mn , respectively.
Earnings from the export of Tea increased y-o-y by 7.93 % to US$610.1 Mn in the period of January to May 2025. This increase was mainly due to the strong performance in the export of Tea Packets (17.73 %).
Export earnings of Coconut & Coconut-based products increased by 26.89 % to US$427.69 Mn during the first five months of 2025 compared to the last year. Earnings from all the major categories of Coconut based products increased in the period of January to May 2025 compared with the corresponding period of 2024 due to the strong performance in export of Coconut Oil (66.33%), Desiccated Coconut (12.88%), Coconut Milk Powder (79.44%), Coconut Cream (50.67%), Liquid Coconut Milk (24.56%), Cocopeat (17.32 %) and Activated Carbon (17.27%).
In addition, export earnings from Spices and Essential Oils increased y-o-y by 53.76% to US$173.64 Mn in the period of first five months of 2025. This increase was due to the strong performance in exports of Pepper (124.75 %), Cinnamon (23.91%) & Cloves (293.32 %).
Export earnings from Food & Beverages have increased by 15.21 % y-o-y to US$231.51 Mn in the first five months of 2025, with the positive performance in exports of Processed food (35.40%).
Furthermore, the estimated value of ICT/ BPM exports is expected to increase by 4.10 % to US$602.59 Mn during the period of January to May 2025, when compared to the corresponding period of 2024.
In addition, the estimated value of Logistics & transport services is expected to increase by 28.89 % to US$895.01 Mn during the period of January to May 2025, when compared to the corresponding period of 2024.
Products with Negative Growth (Decreases)
Export earnings from Rubber & Rubber finished products decreased by 7.25 % to US$386.03 Mn in the first five months of 2025 compared to the same period in 2024, attributed to decreased exports of Pneumatic & Retreated Rubber Tyres & Tubes (-21.39 %).
Further, export earnings from Seafood decreased by 18.12 % to US$88.50 Mn during the first five months of 2025 compared to 2024 due to the negative performance in Fresh Fish (-37.27 %) and Shrimps (-64.44%).
Meanwhile, earnings from the export of Electrical and Electronic Components (EEC) decreased by 0.92 % to US$167.26 Mn in the first five months of 2025 compared to the corresponding period of 2024. This decrease was due to the poor performance in exports of Insulated Wires and Cables (-13.60 %) and Printed Circuits (-61.93%).
Table 1 shows the comparison of Merchandise export performance during the month of May 2025 and the period of January to May 2025 compared to 2024.
Table 1: Comparison of Product-wise Merchandise Export Performance
Values in US$ Mns
| Exports of Goods & Services | 2024 Jan – May |
2025 Jan – May |
% Growth (24-25) |
2024 May |
2025 May |
% Growth (24-25) |
|---|---|---|---|---|---|---|
| Apparel & Textiles | 1,956.65 | 2,136.74 | 9.20 | 390.29 | 388.81 | -0.38 |
| Tea | 565.28 | 610.10 | 7.93 | 115.04 | 131.81 | 14.58 |
| Rubber-based | 416.20 | 386.03 | -7.25 | 81.17 | 73.60 | -9.33 |
| Coconut-based | 337.06 | 427.69 | 26.89 | 69.73 | 92.97 | 33.33 |
| Diamond, Gems & Jewelry | 182.91 | 154.31 | -15.63 | 29.76 | 31.40 | 5.53 |
| Electrical & Electronics | 168.82 | 167.26 | -0.92 | 30.88 | 38.02 | 23.12 |
| Spices and Essential Oils | 112.93 | 173.64 | 53.76 | 25.48 | 30.64 | 20.25 |
| Food & Beverages | 200.95 | 231.51 | 15.21 | 42.22 | 49.49 | 17.22 |
| Seafood | 108.09 | 88.50 | -18.12 | 32.19 | 13.56 | -22.11 |
| Ornamental Fish | 10.53 | 8.02 | -23.84 | 2.02 | 0.86 | -57.43 |
| Vegetables | 12.02 | 11.97 | -0.42 | 2.31 | 1.86 | -19.48 |
| Fruits & Nuts | 15.88 | 17.17 | 8.12 | 2.64 | 3.24 | 22.73 |
| Other Export Crops | 30.33 | 31.25 | 3.03 | 7.06 | 11.20 | 58.64 |
| Flowers & Foliage | 6.06 | 5.45 | -10.07 | 1.12 | 0.75 | -33.04 |
| Boat Building | 11.15 | 21.23 | 90.40 | 0.09 | 0.50 | 455.56 |
| Petroleum Products | 460.37 | 390.78 | -15.12 | 90.58 | 66.47 | -26.62 |
| Others | 472.14 | 482.62 | 2.22 | 88.72 | 85.50 | -3.63 |
| Total Merchandise Exports | 5,067.36 | 5,344.27 | 5.46 | 1,011.30 | 1,028.52 | 1.70 |
| ICT/ BPM | 578.86 | 602.59 | 4.10 | 109.21 | 128.23 | 17.42 |
| Construction | 99.87 | 68.84 | -31.07 | 19.67 | 18.77 | -4.60 |
| Financial Services | 30.67 | 22.69 | -26.03 | 6.86 | 5.00 | -27.14 |
| Transport & Logistics | 694.39 | 895.01 | 28.89 | 156.88 | 206.14 | 31.40 |
| Total Services Exports | 1,403.79 | 1,589.12 | 13.20 | 292.61 | 358.14 | 22.39 |
| Total Goods & Services Exports | 6,471.15 | 6,933.39 | 7.14 | 1,303.91 | 1,386.66 | 6.35 |
Sri Lanka’s Export Performance in Major Markets
Among the top 10 export markets, India, Germany, Netherlands, France and China have shown positive growth in both May 2025 and the cumulative period of January to May 2025 compared to the corresponding periods in 2024.
United States, Sri Lanka’s single largest export destination, which absorbs 23% of Sri Lanka’s merchandise exports, slightly decreased by 2.67 % to US$216.67 Mn in May 2025 compared to May 2024. However, exports to the United States over the cumulative period from January to May 2025 increased by 5.82 %, reaching US$1,182.65 Mn.
Similarly, exports to the United Kingdom decreased by 5.77 % to US$68.37 Mn in May 2025 compared to the corresponding month in 2024. Meanwhile, exports to the United Kingdom increased by 3.85 % to US$392.29 Mn in the cumulative period of January to May 2025 compared to the corresponding period in 2024.
India has continued as Sri Lanka’s second-largest export destination, surpassing the United Kingdom. Exports to India increased by 4.03 % to US$75.33 Mn in May 2025, while cumulative exports from January to May 2025 surged by 31.41 %, reaching US$409.74 Mn compared to the same period in 2024.
Table 2 shows the comparison of the Merchandise export performance of the top 15 export markets during the month of May 2025 and the period of January to May 2025, compared to 2024.
Table 2: Comparison of Merchandise Export Performance of Top 15 Export Destinations
Values in US$ Mns
| Destination | Jan-May 2024 | Jan-May 2025 | % Growth
(24-25) |
May
2024 |
May
2025 |
% Growth
(24-25) |
|
|---|---|---|---|---|---|---|---|
| 1 | United States | 1117.56 | 1182.65 | 5.82 | 222.62 | 216.67 | -2.67 |
| 2 | India | 311.80 | 409.74 | 31.41 | 72.41 | 75.33 | 4.03 |
| 3 | United Kingdom | 377.73 | 392.29 | 3.85 | 72.56 | 68.37 | -5.77 |
| 4 | Italy | 250.92 | 256.76 | 2.33 | 52.33 | 51.05 | -2.45 |
| 5 | Germany | 255.04 | 278.33 | 9.13 | 50.03 | 50.89 | 1.72 |
| 6 | United Arab Emirates | 141.02 | 127.49 | -9.59 | 26.29 | 24.59 | -6.47 |
| 7 | Netherlands | 144.96 | 179.26 | 23.66 | 30.88 | 36.76 | 19.04 |
| 8 | France | 106.99 | 107.72 | 0.68 | 22.05 | 22.91 | 3.90 |
| 9 | Canada | 126.01 | 124.82 | -0.94 | 22.44 | 23.69 | 5.57 |
| 10 | China | 101.21 | 112.58 | 11.23 | 18.10 | 23.81 | 31.55 |
| 11 | Australia | 96.08 | 100.28 | 4.37 | 17.73 | 19.84 | 11.90 |
| 12 | Belgium | 91.37 | 93.80 | 2.66 | 19.31 | 16.60 | -14.03 |
| 13 | Turkey | 55.58 | 46.66 | -16.05 | 13.19 | 10.69 | -18.95 |
| 14 | Japan | 71.14 | 75.04 | 5.48 | 14.31 | 16.84 | 17.68 |
| 15 | Switzerland | 76.71 | 78.19 | 1.93 | 21.14 | 12.78 | -39.55 |
| 16 | Other | 472.14 | 482.62 | 2.22 | 88.72 | 85.50 | -3.63 |
| Total Merchandise Exports | 5,067.36 | 5,344.27 | 5.46 | 1,011.30 | 1,028.52 | 1.70 | |
Exports to FTA Partners (India & Pakistan)
- May 2025
In May 2025, exports to India and Pakistan accounted for 7.86% of total merchandise exports, registering a slight increment of year-on-year growth of 0.79 % to reach US$ 80.81Mn compared to May 2024.
Exports to India increased by 4.03%, primarily driven by increased shipments of Animal Feed and Areca Nuts. Meanwhile, exports to Pakistan decreased by 24.47%, largely attributed to a sharp decline in exports of Desiccated coconuts and Coconut Ekels.
- January – May 2025
During the period from January to May 2025, exports to India and Pakistan accounted for 8.2% of Sri Lanka’s total merchandise exports, recording a substantial increase of 28.02 % to reach US$438.29 Mn compared to the same period in the previous year.
Exports to India increased significantly by 31.41%, driven primarily by increased shipments of Animal feed and Pepper. Meanwhile, exports to Pakistan decreased by 6.55%, due to the decrease in exports of Betel leaves and Other Textiles.
Sri Lanka’s Export Performance in Regions
Table 3 shows the comparison of region-wise exports during the month of May 2025 and the period of January to May 2025 compared to 2024.
Table 3: Comparison of Region wise Merchandise Export Performance
Values in US$ Mns
| Region | Jan-May 2024 | Jan-May 2025 | % Growth
(24-25) |
May
2024 |
May
2025 |
% Growth
(24-25) |
|---|---|---|---|---|---|---|
| NAFTA | 1,313.85 | 1,371.33 | 4.37 | 255.87 | 252.62 | -1.27 |
| European Union (EU) excluding UK | 1,085.02 | 1,181.47 | 8.89 | 220.06 | 231.96 | 5.41 |
| South Asia | 493.35 | 537.80 | 9.01 | 126.43 | 96.57 | -23.62 |
| Middle East Countries (Excl. Cyprus & Egypt) | 425.22 | 437.94 | 2.99 | 292.62 | 300.33 | 2.63 |
| African Countries | 118.92 | 155.54 | 30.79 | 25.07 | 30.67 | 22.34 |
| ASEAN Countries | 133.53 | 161.45 | 20.91 | 23.56 | 47.80 | 102.89 |
| CIS Countries | 111.91 | 109.01 | -2.59 | 24.44 | 22.56 | -7.69 |
| Others | 472.14 | 482.62 | 2.22 | 88.72 | 85.50 | -3.63 |
| Total Merchandise Exports | 5,067.36 | 5,344.27 | 5.46 | 1,011.30 | 1,028.52 | 1.70 |
Exports to the European Union (EU), which account for 24% of Sri Lanka’s exports during both May 2025 and the cumulative period of January to May 2025, increased respectively by 2.63 % and 7.59%.
Exports to the top five EU markets were recoded as; Germany US$ 278.33 Mn (increased by 9.13 %), Italy US$ 256.76 Mn (increased by 2.33 %), Netherlands US$ 179.26 Mn (increased by 23.66 %), France US$ 107.72 Mn. (increased by 0.68 %) and Belgium US$ 93.80 Mn (increased by 2.66 %) during the cumulative period of January to May 2025 in comparison to the corresponding period in 2024. (Newswire)