Sri Lanka’s export sector has continued its strong upward trajectory, recording a significant 6.0 % growth during the period from January to October 2025, the Sri Lanka Export Development Board (EDB) reported.
According to data released by Sri Lanka Customs, along with estimated figures for Gems & Jewellery and Petroleum Products, total exports reached US$ 14,433.82 million, surpassing the performance of the corresponding period in 2024.
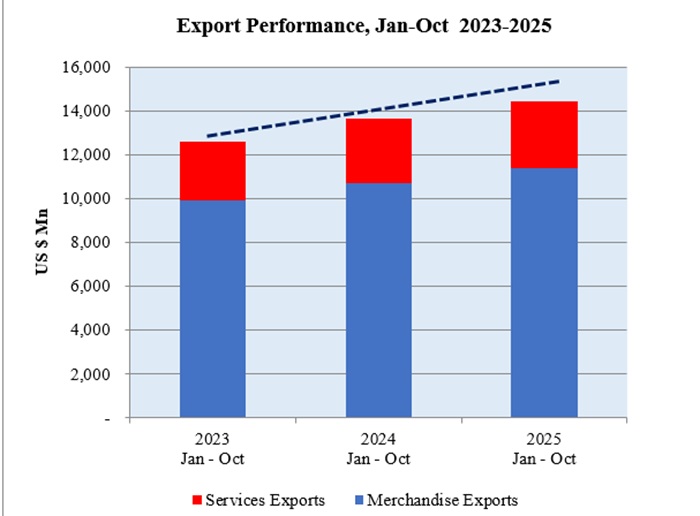
This also marks the first time that exports have exceeded the 14 billion Dollar mark within the first ten months of a year. A key highlight is that exports of coconut-based products surpassed the US$ 1 billion mark during this period for the first time.
Commenting on this achievement, Mangala Wijesinghe, Chairman and Chief Executive Officer of the Export Development Board (EDB), stated: “This is the highest-ever export figure recorded for the January–October period in Sri Lanka’s history. The continued recovery of key Western markets, along with the steady production capacity maintained by local industries, has played a pivotal role in driving this growth. I commend our exporters for their resilience and outstanding performance. Notably, 80% of the annual export target of US$ 18 billion has already been realized during this period.”
In October 2025 alone, total exports, comprising both merchandise and services, reached US$ 1,474.38 million, reflecting a month-on-month increase of 2.2 % compared with September 2025. However, this also represents a slight year-on-year increase of 0.16% compared with October 2024.
Despite the marginal annual decrease, the October performance underscores the resilience of Sri Lanka’s export sector and the continued effectiveness of strategies aimed at expanding market access and strengthening global competitiveness.
Meanwhile, services exports have emerged as a key driver of overall export growth. In October 2025, earnings from services exports are estimated to be US$ 316.14 million. Over the first ten months of the year, services exports are estimated to have increased by 4.01 %, reaching US$ 3,060.21 million. This trend highlights the rising importance of Sri Lanka’s knowledge-based economy and its growing contribution to national export earnings.
The services export sector, comprising ICT/BPM, Construction, Financial services, and Transport & Logistics, continues to diversify Sri Lanka’s export portfolio and create high-value employment opportunities across the Island.
Full report:
Major Exports in October 2025
- Products and Services with Positive Growth (Increases)
A monthly analysis reveals that export earnings from coconut-based products showed a significant increase of 60.46 % in October 2025 compared to the same month in 2024. Notably, earnings from Coconut kernel products increased by 75.05 %, Coconut fibre products by 19.84 %, and Coconut shell products by 77.56 %, reflecting strong global demand and improved value addition across the sector.
Export earnings from Coconut Oil, Coconut Milk powder, Coconut Cream and Liquid Coconut Milk, which are categorized under the Coconut kernel products, increased by 111.36 %, 38.3 %, 185.07 % and 90.84 % respectively in October 2025 compared to October 2024.
Being the largest contributor to the coconut-based sector, Coco Peat, Fibre Pith & Moulded products, which are categorized under the Coconut fibre products, increased by 19.71 % to US$ 20.59 Mn in October 2025 in comparison to October 2024.
Earnings from Activated Carbon, which is categorized under the Coconut shell products, increased by 77.56 % to US$ 21.68 Mn in October 2025 compared to October 2024.
Export earnings from Food & Beverages have increased by 20.17 % y-o-y to US$ 71.25 Mn in October 2025, with the positive performance in exports of Processed Food (27.15 %).
The estimated value of Diamonds, Gems & Jewellery is expected to increase by 26.74 % to US$ 39.2 Mn in October 2025 when compared to October 2024.
Export earnings from Electrical & Electronics Components increased by 5.18 % y-o-y to US$ 38.76 Mn in October 2025.
Furthermore, the estimated value of ICT/ BPM exports is expected to increase by 26.71 % to US$ 154.5 Mn in October 2025 when compared to October 2024.
Products with Negative Growth (Decreases)
Export earnings from Apparel & Textiles recorded a slight year-on-year decline of 0.24%, amounting to US$ 429.17 Mn in October 2025 compared with the same month in 2024.
Export earnings from tea, which made up 12.8% of merchandise exports, decreased by 0.21 % y-o-y to US$ 126.55 Mn in October 2025 compared to October 2024. This increase is mainly due to the poor performance in the export of Bulk Tea (-5.08 %).
Export earnings from Rubber and Rubber Finished products have decreased by 5.4 % y-o-y to US$ 80.12 Mn in October 2025, with the negative performance in exports of Pneumatic & Retreated Rubber Tyres & Tubes (-3.8 %) and Industrial & Surgical Gloves of Rubber (-6.33%).
Meanwhile, exports of Spices and Essential Oils decreased by 25.17 % to US$ 38.39 Mn in October 2025, largely driven by a sharp decline in pepper exports to India, which decreased by 73.6 %.
Export earnings from Seafood decreased by 9.54 % to US$ 15.36 Mn in October 2025 compared to October 2024. This increase was mainly due to the negative performance in the export of Fish Fresh or Chilled (-9.52 %) and Shrimps (-61.31 %).
Export earnings from Ornamental fish decreased by 18.78 % to US$ 1.6 Mn in October 2025 compared to October 2024.
Similarly, the estimated export value of Logistics & Transport Services is projected to decrease by 13.44 % to US$ 144.5 Mn in October 2025, compared to October 2024.
Exports during the period of January – October 2025
Cumulative total exports, including both merchandise and services, were estimated at US$ 14,433.82 Mn for the period January to October 2025, making a notable 5.99 % growth compared to the same period in 2024.
Merchandise exports during the period of January to October 2025 are estimated to increase by 6.53 %, reaching US$ 11,373.6 Mn, based on data from Sri Lanka Customs, along with the estimated figures for Gems & Jewellery and Petroleum Products.
Meanwhile, the estimated value of services exports is expected to increase by 4.01 % to US$ 3,060.21 Mn compared to the corresponding period in 2024.
Products & Services with Positive Growth (Increases)
Earnings from the export of Apparel, Tea, Coconut products, and Food & Beverages increased by 5.56 %, 8.72 %, 43.83 %, and 24.89% respectively during the period of January to October of 2025 in comparison to the corresponding period of 2024.
Earnings from the export of Apparel & Textile have increased by 5.56 % to US$ 4,440.85 Mn during the period of January to October 2025 compared to the same period in 2024. Notably, exports to the United States, the United Kingdom and the EU region increased by 1.67 %, 1.19 % and 13.82 % amounting to US$ 1,630.51 Mn, US$ 588.72 Mn and US$ 1,330.6 Mn, respectively.
Earnings from export of Tea increased y-o-y by 8.72 % to US$ 1,289.58 Mn in the period of January to October 2025. This increase was mainly due to the strong performance in the export of Tea Packets (15.18 %).
Export earnings of Coconut & Coconut-based products increased by 43.83 % to US$ 1,033.09 Mn during the period January to October of 2025 compared to the last year. Earnings from all the major categories of Coconut based products increased in the period of January to October 2025 compared with the corresponding period of 2024 due to the strong performance in export of Coconut Oil (81.56 %), Desiccated Coconut (36.93 %), Coconut Milk Powder (72.56 %), Coconut Cream (92.46 %), Liquid Coconut Milk (53.32 %), Cocopeat (24.48 %) and Activated Carbon (28.52%).
Export earnings from Food & Beverages have increased by 24.89 % y-o-y to US$ 499.9 Mn in the period of January to October of 2025, with the positive performance in exports of Processed food (44.72 %).
In addition, export earnings from Seafood increased by 1.81 % to US$ 199.92 Mn during the period of January to October of 2025, compared to 2024, due to the positive performance in Frozen Fish (18.08%).
Meanwhile, earnings from the export of Electrical and Electronic Components (EEC) increased by 2.14 % to US$ 354.73 Mn in the period of January to October of 2025 compared to the corresponding period of 2024. This increase was due to the positive performance in exports of Insulated Wires (6.29%) and Electrical Transformers (6.67 %).
Furthermore, the estimated value of ICT/ BPM exports is expected to increase by 9.25 % to US$ 1,334.09 Mn during the period of January to October 2025, when compared to the corresponding period of 2024.
In addition, the estimated value of Logistics & transport services is expected to increase by 6.07 % to US$ 1,572.19 Mn during the period of January to October 2025, when compared to the corresponding period of 2024.
Products with Negative Growth (Decreases)
Export earnings from Rubber & Rubber finished products decreased by 5.92 % to US$ 793.7 Mn in the period of January to October 2025 compared to the same period in 2024, attributed to decreased exports of Pneumatic & Retreated Rubber Tyres & Tube (-15.21%).
In addition, export earnings from Spices and Essential Oils increased y-o-y by 1.38 % to US$ 368.24 Mn in the period of January to October 2025. This increase was due to the negative performance in exports of Pepper (-38.33 %).
In addition, export earnings from Ornamental fish decreased by 5.41 % to US$ 19.57 Mn in the period of January to October 2025compared to the same period in 2024
Table 1 shows the comparison of Merchandise export performance during the month of October 2025 and the period of January to October 2025 compared to 2024.
Table 1: Comparison of Product-wise Merchandise Export Performance
Values in US$ Mns
| Exports of Goods & Services | 2024 Jan – Oct |
2025 Jan – Oct |
% Growth (24-25) |
2024 Oct |
2025 Oct |
% Growth (24-25) |
|---|---|---|---|---|---|---|
| Apparel & Textiles | 4,206.95 | 4,440.85 | 5.56 | 430.21 | 429.17 | -0.24 |
| Tea | 1,186.10 | 1,289.58 | 8.72 | 126.81 | 126.55 | -0.21 |
| Rubber-based | 843.61 | 793.70 | -5.92 | 84.69 | 80.12 | -5.40 |
| Coconut-based | 718.25 | 1,033.09 | 43.83 | 77.26 | 123.97 | 60.46 |
| Diamond, Gems & Jewelery | 337.67 | 338.75 | 0.32 | 30.93 | 39.20 | 26.74 |
| Electrical & Electronics | 347.30 | 354.73 | 2.14 | 36.85 | 38.76 | 5.18 |
| Spices and Essential Oils | 373.40 | 368.24 | -1.38 | 51.30 | 38.39 | -25.17 |
| Food & Beverages | 400.27 | 499.90 | 24.89 | 59.29 | 71.25 | 20.17 |
| Seafood | 196.36 | 199.92 | 1.81 | 16.98 | 15.36 | -9.54 |
| Ornamental Fish | 20.69 | 19.57 | -5.41 | 1.97 | 1.60 | -18.78 |
| Vegetables | 24.15 | 29.98 | 24.14 | 2.84 | 2.36 | -16.90 |
| Fruits & Nuts | 34.48 | 41.48 | 20.30 | 3.97 | 4.08 | 2.77 |
| Other Export Crops | 53.96 | 79.90 | 48.07 | 4.15 | 9.23 | 122.41 |
| Flowers & Foliage | 11.53 | 12.45 | 7.98 | 1.21 | 1.33 | 9.92 |
| Boat Building | 40.35 | 36.94 | -8.45 | 14.60 | 0.24 | -98.36 |
| Petroleum Products | 905.50 | 802.88 | -11.33 | 121.44 | 83.00 | -31.65 |
| Others | 975.47 | 1,031.65 | 5.76 | 93.49 | 93.63 | 0.14 |
| Total Merchandise Exports | 10,676.04 | 11,373.60 | 6.53 | 1,158.00 | 1,158.24 | 0.02 |
| ICT/ BPM | 1,221.19 | 1,334.09 | 9.25 | 121.93 | 154.50 | 26.71 |
| Construction | 191.48 | 115.19 | -39.84 | 22.58 | 13.33 | -40.98 |
| Financial Services | 47.51 | 38.74 | -18.46 | 2.58 | 3.81 | 47.60 |
| Transport & Logistics | 1,482.16 | 1,572.19 | 6.07 | 166.94 | 144.50 | -13.44 |
| Total Services Exports | 2,942.34 | 3,060.21 | 4.01 | 314.04 | 316.14 | 0.67 |
| Total Goods & Services Exports | 13,618.38 | 14,433.82 | 5.99 | 1,472.04 | 1,474.38 | 0.16 |
Sri Lanka’s Export Performance in Major Markets
Among the top 10 export destinations, Germany, Italy, the Netherlands, the United Arab Emirates, Canada, France and China recorded year-on-year growth in October 2025 as well as during the cumulative period from January to October 2025.
The United States, Sri Lanka’s largest single export market, accounting for 23% of the country’s merchandise exports, recorded a slight 0.46% decline to US$ 246.2 Mn in October 2025 compared to October 2024. However, exports to the United States increased by 2.68% during the period of January to October period, reaching US$ 2,498.04 Mn.
India has continued as Sri Lanka’s second-largest export destination, surpassing the United Kingdom. Exports to India decreased by 10.03 % to US$ 74.49 Mn in October 2025, while cumulative exports from January to October 2025 increased by 19.31 %, reaching US$ 866.9 Mn compared to the same period in 2024.
Exports to the United Kingdom decreased by 5.38 % to US$ 70.36 Mn in October 2025 compared to the same month in 2024. During the cumulative period from January to October 2025, exports to the UK recorded a growth of 3.45 %, reaching US$ 792.1 Mn compared to the corresponding period in 2024.
Table 2 shows the comparison of the Merchandise export performance of the top 15 export markets during the month of October 2025 and the period of January to October 2025, compared to 2024.
Table 2: Comparison of Merchandise Export Performance of Top 15 Export Destinations
Values in US$ Mns
| Destination | 2024 Jan – Oct |
2025 Jan – Oct |
% Growth (24-25) |
2024 Oct |
2025 Oct |
% Growth (24-25) |
|
|---|---|---|---|---|---|---|---|
| 1 | United States | 2,432.78 | 2,498.04 | 2.68 | 247.33 | 246.20 | -0.46 |
| 2 | India | 726.57 | 866.90 | 19.31 | 82.79 | 74.49 | -10.03 |
| 3 | United Kingdom | 765.67 | 792.10 | 3.45 | 74.36 | 70.36 | -5.38 |
| 4 | Germany | 505.21 | 572.90 | 13.40 | 63.33 | 66.12 | 4.41 |
| 5 | Italy | 526.83 | 597.78 | 13.47 | 49.50 | 61.84 | 24.93 |
| 6 | Netherlands | 280.50 | 290.11 | 3.43 | 24.26 | 30.82 | 27.04 |
| 7 | United Arab Emirates | 316.48 | 390.68 | 23.45 | 30.91 | 44.02 | 42.41 |
| 8 | Canada | 222.92 | 236.53 | 6.11 | 23.68 | 23.84 | 0.68 |
| 9 | France | 270.24 | 272.57 | 0.86 | 27.07 | 27.70 | 2.33 |
| 10 | China | 206.86 | 224.80 | 8.67 | 20.34 | 23.53 | 15.68 |
| 11 | Australia | 202.25 | 214.11 | 5.86 | 21.54 | 19.85 | -7.85 |
| 12 | Belgium | 196.59 | 210.32 | 6.98 | 22.51 | 22.83 | 1.42 |
| 13 | Hong Kong | 107.35 | 169.31 | 57.72 | 9.43 | 13.91 | 47.51 |
| 14 | Switzerland | 140.32 | 161.87 | 15.36 | 13.55 | 15.02 | 10.85 |
| 15 | Iraq | 126.51 | 164.65 | 30.15 | 14.68 | 18.24 | 24.25 |
| 16 | Other Markets | 3,648.96 | 3,710.93 | 1.70 | 432.72 | 399.47 | -7.68 |
| Total Merchandise Exports | 10,676.04 | 11,373.60 | 6.53 | 1,158.00 | 1,158.24 | 0.02 | |
Exports to FTA Partners (India & Pakistan)
- October 2025
In October 2025, exports to India and Pakistan accounted for 7.86% of Sri Lanka’s total merchandise exports, recording a year-on-year decline of 8.52% to US$ 82.03 Mn, compared with October 2024.
Exports to India decreased by 10.03%, primarily due to a drop in Pepper and Petroleum products exports. In contrast, exports to Pakistan increased by 9.59%, driven mainly by higher shipments of desiccated coconut.
- January – October 2025
During the period from January to October 2025, exports to India and Pakistan accounted for 8.2% of Sri Lanka’s total merchandise exports, recording a substantial increase of 17.56 % to reach US$ 930.38 Mn compared to the same period in the previous year.
Exports to India increased significantly by 19.31 %, driven primarily by increased shipments of Petroleum Oil, Animal feed and Animal or Vegetable Fats and Oils and their Products. Meanwhile, exports to Pakistan decreased by 2.08 %, due to the decrease in exports of Betel Leaves.
Sri Lanka’s Export Performance in Regions
Table 3 shows the comparison of region-wise exports during the month of October 2025 and the period of January to October 2025 compared to 2024.
Table 3: Comparison of Region-wise Merchandise Export Performance
Values in US$ Mns
| Region | 2024 Jan – Oct |
2025 Jan – Oct |
% Growth (24-25) |
2024 Oct |
2025 Oct |
% Growth (24-25) |
|---|---|---|---|---|---|---|
| NAFTA | 2,851.12 | 2,920.98 | 2.45 | 291.20 | 291.26 | 0.02 |
| European Union (EU) excluding UK | 2,283.97 | 2,613.59 | 14.43 | 252.29 | 283.99 | 12.56 |
| South Asia | 1,125.53 | 1,162.51 | 3.29 | 162.56 | 110.19 | -32.22 |
| Middle East Countries (Excl. Cyprus & Egypt) | 808.02 | 882.66 | 9.24 | 75.41 | 89.73 | 18.99 |
| African Countries | 262.23 | 346.78 | 32.24 | 32.44 | 32.59 | 0.46 |
| ASEAN Countries | 289.46 | 377.43 | 30.39 | 24.05 | 55.20 | 129.52 |
| CIS Countries | 238.01 | 225.57 | -5.23 | 27.67 | 20.74 | -25.05 |
| Others | 2,817.70 | 2,844.08 | 0.94 | 292.38 | 274.54 | -6.10 |
| Total Merchandise Exports | 10,676.04 | 11,373.60 | 6.53 | 1,158.00 | 1,158.24 | 0.02 |
Exports to the European Union (EU), which account for 24% of Sri Lanka’s merchandise exports, increased during both October 2025 and the cumulative period of January to October 2025, respectively by 14.43 % and 12.56 %.
Exports to the top five EU markets were recoded as; Germany US$ 597.78 Mn (increased by 13.47 %), Italy US$ 572.9 Mn (increased by 13.4 %), Netherlands US$ 390.68 Mn (increased by 23.45 %), France US$ 236.53 Mn. (increased by 6.11 %) and Belgium US$ 210.32 Mn (increased by 6.98 %) during the cumulative period of January to October 2025 in comparison to the corresponding period in 2024. (Newswire)