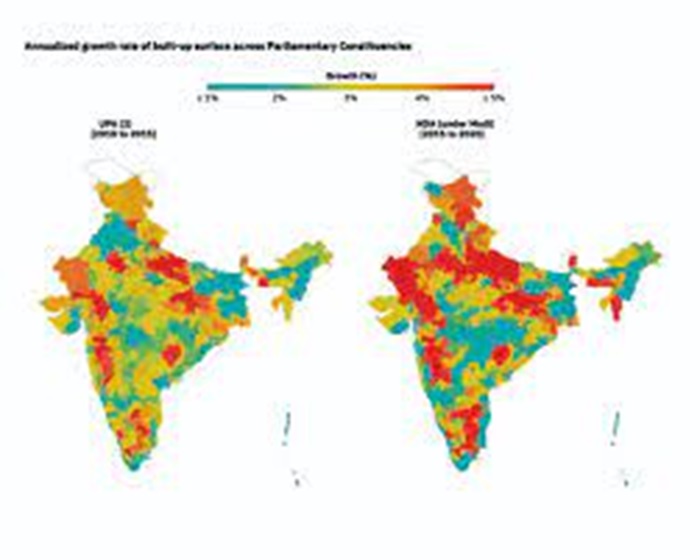
A study of the growth rates at local levels using high-resolution daytime satellite imagery data on built-up surfaces, shows significantly higher growth of built-up surface under the Modi years of 2015-2020 than the UPA years of 2010-15. The paper, “Politics in Action” by Shamika Ravi, member of the Economic Advisory Council to the Prime Minister, and Mudit Kapoor, Professor at the Indian Statistical Institute, computes the annualised growth rate from 2010 to 2015 and between 2015 and 2020, cuts across districts, sub-districts and Parliament constituencies across the country and assesses the level of construction activity. “At the all India level we can say, yes, constituencies or India’s construction as such across all parliamentary constituencies (PC) grew at about 18% higher on average than it did under the previous five years,” Ravi told The Sunday Guardian during an interaction.
Built up area constitutes anything the satellite image captures and gives an idea of how much of construction has taken place. “It can be anything from a small railway station to new roads, a new house and even the shed in the new house—everything will have been captured,” says Ravi. The paper, coming months before the general elections, testing the Prime Minister Narendra Modi-led NDA’s 10-year governance record, is premised on a wide acceptance that in a vibrant democracy, assessing the economic performance under different political regimes is crucial. However, the debate which gains traction near national elections, tends to centre on comparing growth rates or poverty reduction at the macro level. The paper is an effort to provide a more meaningful commentary of politics in action by assessing the economic performance at the parliamentary constituency level, district and sub-district level. The data set for the analysis comes from Global Human Settlement Layer (GHSL) project supported by the European Commission in partnership with the GEO Human Planet Initiative.
While construction has always been a core business, with a growing share in India’s GDP, the centrality of the activity in satellite image-based data research is unique. “Construction is one of India’s high job creators, it is labour intensive and thus serves as a good indicator of economic activity,” notes Ravi. Thus by gauging the strength of economic activity in an area, one can see the level of growth. “We have annualised it and observed the same area, as to how it has developed over a time period to assess the overall growth. What we have presented is the annualised growth rates which have been estimated based on the high frequency of the images. So we know exactly what is happening in a given region,” points out Shamika Ravi.
This exercise of mapping the progressive development of a built up area, however, has been extensive, covering all the 543 PCs in the country across all states and UTs. What renders precision and accuracy to the data is, as Shamika Ravi points out, the resolution and the granularity of the data are fantastic as the satellite imagery captures all forms of construction – roads, buildings, even an outhouse in a building is a constructed area. “Here is a data where there is no change in baseline year. The reason we look at the data is because it is high quality, very granular, real time and we don’t have to wait for survey results to come out. The data is available and easy for anyone to go out and replicate all this. The way India is growing and if we have this kind of granular data, we can capture growth,” says Ravi.
The report shows that during UPA II (2010 to 2015) and NDA (under Modi), the annualised growth rate in total built-up surface was higher in less developed parliamentary constituencies with a lower ratio of total built-up surface to total area. For example, in 2010, the percentage of total built-up surface to total area was less than 1.2% in 50% of the parliamentary constituencies. For 2015, this ratio was less than 1.4% in 50% of the constituencies. During UPA 2, the median parliamentary constituency, which had a ratio of total built-up surface to the total area of 1.2%, grew on an average at 2.9%. Growth rates were significantly higher in less developed parliamentary constituencies (in terms of the ratio of built-up surface to total area) during the NDA (under Modi) as compared to UPA II which implies that inequalities in terms of built-up surface across parliamentary constituencies declined faster during the NDA (under Modi) than during UPA II.
The comparison of the performance of political parties across the parliamentary constituencies during the NDA under Prime Minister Modi shows the mean annualized growth rate in parliamentary constituencies under the BJP was 3.9% and it varied across the parliamentary constituencies, where the maximum was 19.2% and the minimum was 0.1%. The mean annualized growth rate for the INC was 2.8%, with the maximum at 12.1% and the minimum at 0.3%. For Others, the mean annualized growth rate across parliamentary constituencies was 2.6%, with the maximum at 18.4% and the minimum at 0.1%.
“It is important to understand that things did happen in the UPA,” says Ravi. According to her data, in UPA I, there was 2.6.% growth annualized, which is significant. “Of course UPA 2 saw that picking up with huge projects and a big push. The difference under the Modi Government, is that it has gone into mission mode,” adds Ravi. The biggest takeaway of the report is that India’s real economy on the ground is changing and growing at a pace which we are not able to adequately capture,” Ravi told The Sunday Guardian. “Looking at these new
modern data gives us a more realistic and granular information,” adds Ravi. According to her, it is impossible for the data systems to capture data at sub district level or district level even. “We do estimate growth at state level but also through implications. Here this is real time, we know exactly how much construction is happening,” says Ravi.
From the distributional point of view, the analysis of where has growth been focused, the deeper print reveals that in the Modi years spanning 2015-2020, growth has been largely focused on the least developed parts of the country. According to the EAC member, there has been a greater convergence that has happened in the last five years than in the previous ones. In fact, as Shanika Ravi underlines, the data maps progress in bridging the rural-urban divide in terms of the built-up area which can play a pivotal role in alleviating rural distress. “This is useful in that sense. One of the definitions of urban is density and construction and of course there is employment. But if you see the result of how this kind of growth in construction is distributed across the country, we see that at the sub district level, at the district level as well as the parliamentary constituency, in the years since 2015, there has been a massive expansion in the remotest and the least constructed parts,” says the report’s author.
Indeed, the annualized growth rates of the built-up surface during the NDA (under Modi) in the less developed districts or sub-districts in terms of the ratio of total built-up surface to the total area, was significantly higher than during UPA (2). These results at the district and sub-district level suggest that regional inequalities in terms of built-up surface reduced faster during the NDA (under Modi).
The paper, in fact argues that in some sense, the NDA under Modi has done more for convergence by putting much more focus on the underdeveloped pockets of the country. The results of the push are tangible in the Northeast where this push has impacted the Gangetic plain, Rajasthan, tribal areas of Madhya Pradesh, Gujarat, Maharashtra, Andhra, Bihar and Jharkhand, both of which have seen massive growth led by construction activity. “These are all places where there has been more than 2% annualised growth. If you see the entire northeast, the western part, it is more than 5%. The highest growth has happened in the remotest part,” emphasises Ravi.
The PM EAC member feels the analysis has limited the scope to sub districts. “We should do even further,” feels Ravi, given the significance and long term implications of the data and analysis for administrative efficiency and India’s growth prospects. For instance, to a block development officer, this kind of data can be hugely useful if they do weekly monitoring of a specific project. Given how large the country is, the states too have a role, and so do administrations at the local level where policies are implemented. “We have already moved towards precision policy,” observes Ravi, highlighting the importance of district aspirational programmes in last mile policy implementation. With government focus shifting to aspirational blocks, the impact of data of this nature in monitoring development can be transformational, according to Ravi.
There are, though, limitations of daytime satellite imagery data which is suitable for capturing the spatial expanse of economic markets or the extensive margins of economic activity. More research is needed at the micro level to ensure that data produced from the daytime satellite imagery reflect the economic realities on the ground, the paper notes. (The Sunday Guardian)